- Home
- Directory
-
Our Programs
-
Strategic Advocacy Course
- Collaborations
- Humane Education
- International Policy
-
Model Animal Welfare Act
- Get the Book!
- Contents
- Part 1: Guiding Principles - A Broad Overview
- Part 2: Proposal for the Wording of a New Animal Welfare Act
-
Part 3: Explanatory Notes
- Notes to Chapter 1: Preliminary Provisions
- Notes to Chapter 2: General Provisions
- Notes to Chapter 3: Keeping of Animals/Care of Animals
- Notes to Chapter 4: Specific Categories of Animal Use
- Notes to Chapter 5: Implementation and Enforcement Provisions
- Notes to Chapter 6: Penal and Final/Concluding Provisions
- Constitution Project
-
Strategic Advocacy Course
-
Resources
- Events
- About Us
- Blog
- font size decrease font size increase font size
- No comment

Category:
Optional
Description and Purpose:
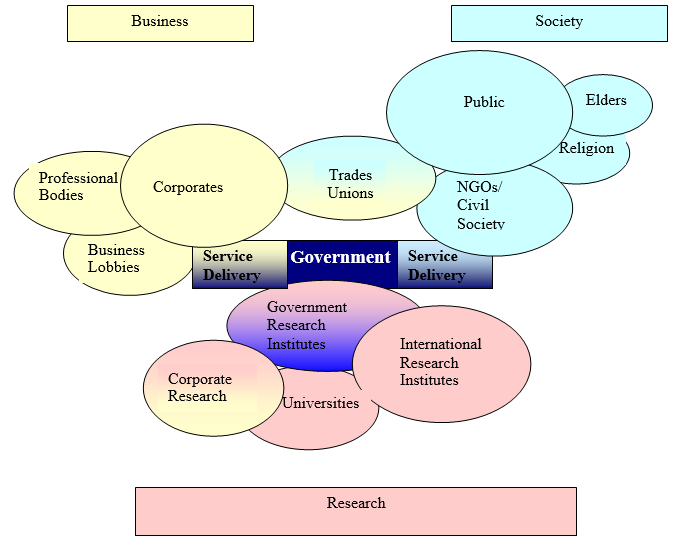
This is a stakeholder mapping tool that shows the key organizations and individuals involved in an advocacy issue, together with their relationships. Also knows as a Chapatti Diagram.
Method:
First ask the group to identify key organizations and individuals involved in the advocacy issue. Record these on a list.
Then draw or cut out a circle (or other shape) for each organization or individual. Bigger circles indicate more important stakeholders.
The circles are labelled.
If your issue is centered on government policy, then you can make government a central block of the diagram (e.g. represented by a different shape, color or block).
Next, the group identifies the degree of contact and overlap between each circle. Overlap occurs if one individual or institution asks or tells another to do something or if they have to cooperate in some way. Arrange as follows:
- Separate circles = no contact (or no meaningful contact)
- Touching circles = limited contact (e.g. information passes between institutions)
- Small overlap = some co-operation in decision making
- Large overlap = considerable co-operation in decision making
Draw the diagram first in pencil (or on a computer) and adjust the size or arrangement of circles until the representation is accurate. Alternatively, use lengths of string – these can be expanded or contracted until the right size is agreed. A reproduction of the string/paper/pencil circles ensures a permanent record. Secondary sources, group interviews or key informants can be used to validate information.
When you write up, you can add color-coding to indicate allegiances or categories.
The process of forming a diagram gives rise to useful observations and discussions.
A simple example follows:
The example given in this tool helps to provide important contextual information, such as the way in which research underpins decision-making (which is an area in which civil society can be weak – especially the funding of original research). Also, the link between service delivery and advocacy (where the close contact can help with ongoing advocacy, but also brings its own restraints in terms of adversarial advocacy – for fear of losing contracts and jobs).


