


Category:
Optional
Description and Purpose:
This is a tool for plotting project activities against a ‘Time-Line’.
Method:
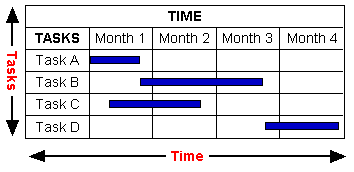
A Gantt chart is a ‘Time-Line’, which plots project activities against a calendar (as below example). Durations for each task are shown graphically on a timescale ranging from hours to a year. You can adapt the chart to suit your own project and the timescale you need to cover. You can also include views of tasks, resources, or resource usage by task, for example:
Gantt Charts are useful tools for analyzing and planning more complex projects. They:
- Help you to plan out the tasks that need to be completed
- Give you a basis for scheduling when these tasks will be carries out
- Allow you to plan the allocation of resources needed to complete the project
- Help you to analyze and manage the dependencies between tasks.
At the implementation planning stage, Gantt charts can help to identify periods of scare resources, enabling the timing of activities to be changed in order to prevent blockages (and stress!). They are a useful tool to test the feasibility of plans (in terms of time and resource usage).
When a project is underway, Gantt charts are useful for monitoring progress. You can immediately see what should have been achieved at a point in time, and can therefore take remedial action to bring the project back on course. This can be essential for the successful implementation of the project.